Your premium is set by one number. Three things move it.
Loss ratio is how an insurer prices your fleet. Fewer at-fault claims, faster defence against the false ones and shorter claims all pull it the same way.
Every week a claim stays open it costs more. Legal, repair, hire, injury.
A high loss ratio raises your premium. It also shortens the list of insurers willing to quote at all.
A non-fault or fraudulent claim costs the same to defend as an at-fault one, unless the evidence closes it early.
A camera that failed last month reaches you as a claim you cannot answer. It lands on your budget, not in a safety report.
HOW MANTIS HELPS
Predict. Prevent. Prove. Built around your responsibility.
01 / PREDICT
Budget the risk before it is a claim.
Collision Likelihood and Trip Risk scoring show where exposure is rising, by driver and by route. A renewal conversation then starts from where the fleet is heading rather than only from what it has already paid out.
02 / PREVENT
Go after the at-fault claims.
Risk-targeted coaching addresses the drivers and behaviours behind at-fault claims. Those are the claims your own conduct can change, which is why they are the ones worth spending effort on.
03 / PROVE
Defend the claims that should cost you nothing.
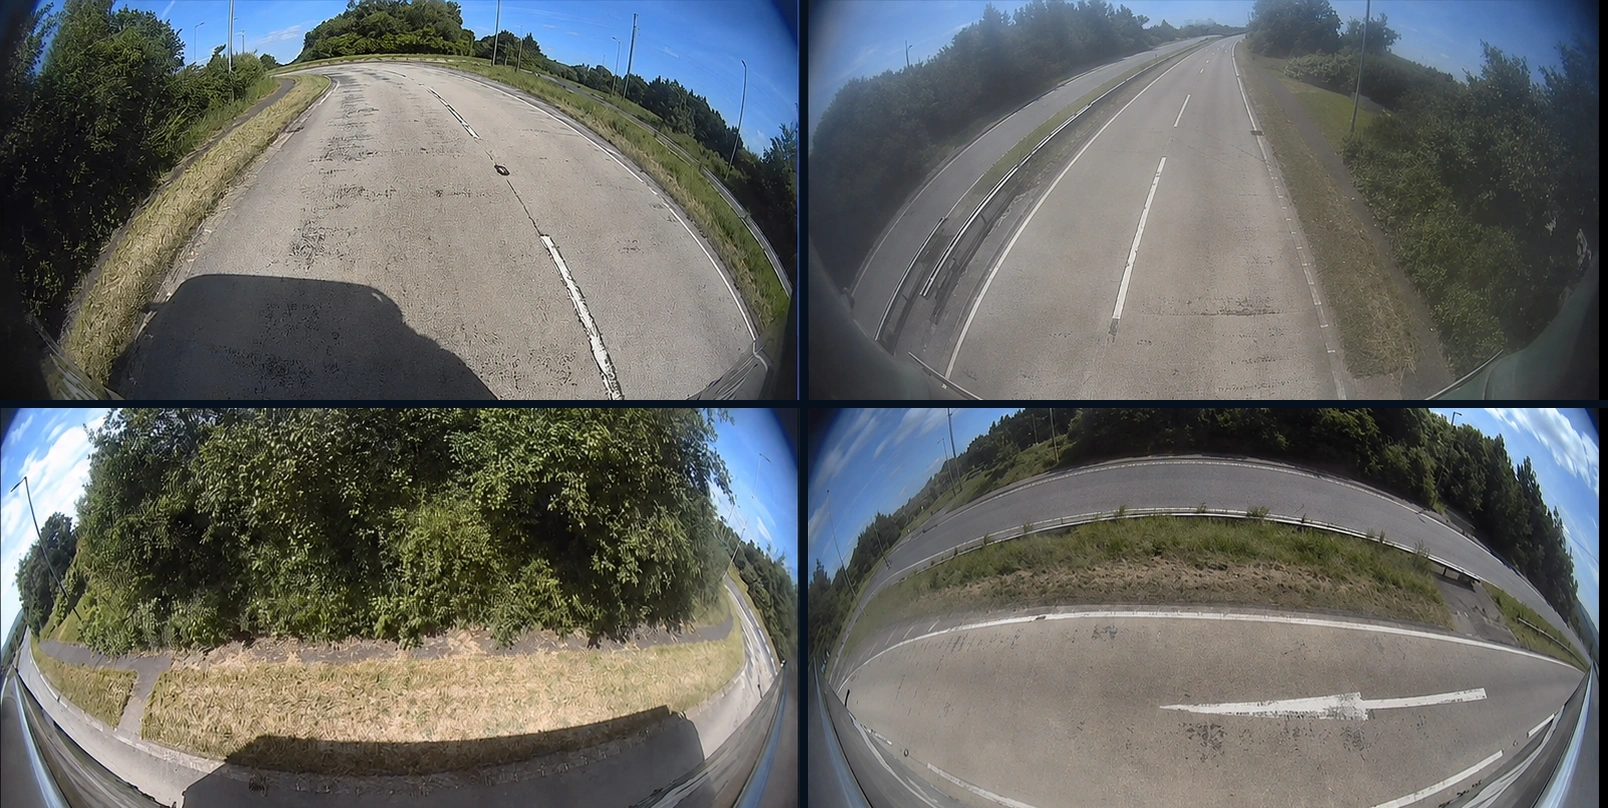
Multi-camera evidence and an automatically assembled Claims Pack put a clean account of the incident in front of the insurer early. Getting there first is what shortens a disputed claim, and the cost sits inside the time it stays open.
THE NUMBER YOUR PREMIUM IS BUILT ON
Loss ratio = (claims paid + expenses) ÷ premium collected.
It is the number an underwriter reaches for first, and the one your premium is built on.
Around 40% and below
Insurers generally compete for the account, and you have a choice of who writes it.
Above about 60%
Premiums tend to rise and the field of insurers willing to quote narrows.
At and above 100%
The account is paying out more than it brings in, and cover becomes hard to place at any price.
One 250-vehicle fleet moved from a 62% loss ratio to 47% after video-led coaching, saving £250,000 in the first year.
The bands describe how insurers generally read a loss ratio rather than fixed underwriting thresholds, and they carry no source. The worked example is an illustrative figure from existing MANTIS marketing material, not a named customer, a typical result or a promised one. Your own figures depend on your fleet, your claims history and your insurer.
FROM THE SIGNAL TO THE DECISION
One record behind the number. The exposure, the evidence and what the fleet did about both.
Use the platform to keep the evidence, the context and the next action together.
EVIDENCE CENTRE / ON DEMAND
Find the moment. See every angle.
DEMO-001 · Camera-view demonstration
Trip → time → cameraRetained video
Preserve the relevant evidence
Illustrative software concept with supplied, privacy-edited daytime camera stills. Camera numbers are demo labels, not verified installation positions. This preview does not play or download footage.
YOUR WORKFLOW
A practical path through the working day.
01
Track the exposure
See where risk is rising across the fleet, by driver and by route, before it arrives as a claim.
02
Defend what should not cost you
Use the footage to close non-fault and fraudulent claims early, rather than paying out or carrying a dispute you would win on the video.
03
Take it into the renewal
Bring your broker a documented trend rather than an account of a good year.
Illustrative capabilities depend on the selected equipment, available recordings and configuration. Evidence supports professional review; it does not determine medical injury, establish liability, guarantee admissibility or promise a claim outcome, premium reduction or financial return.